5. Dashboard
The dashboard enables you to monitor and analyze key performance indicators: data and statistics, in real time or for a desired period, on documents and user connections to optimize collaboration, traceability and information accessibility.
In the , clck on to access performance indicators:
5.1. Workspace storage usage
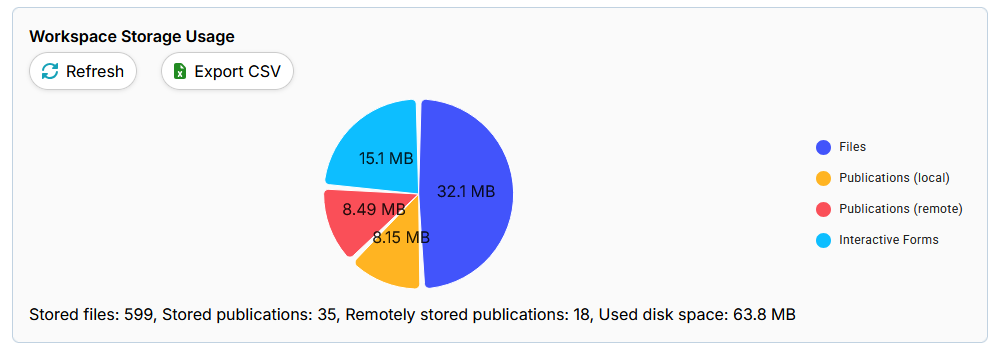
In “Workspace storage usage”, you can see how much disk space is being used, as well as the distribution of storage between files, publications (local and remote) and interactive forms.
5.1.1. Items displayed :
Stored files : Total number of files stored.
Stored publications: Number of publications stored locally.
Publications stored remotely: Publications hosted on an external server.
Disk space used: total size of data stored in the workspace.
5.1.2. Actions available :
Refresh: Updates the data displayed in the workspace storage in real time.
Export CSV: Uploads a summary file of information concerning the storage of files in the workspace in csv format.
5.1.3. Storage diagram
A pie chart illustrates the distribution of space used by :
Files:
Local publications
Remote publications
Interactive forms
Each category is represented by a distinct color for quick viewing.
5.2. Publications created by user
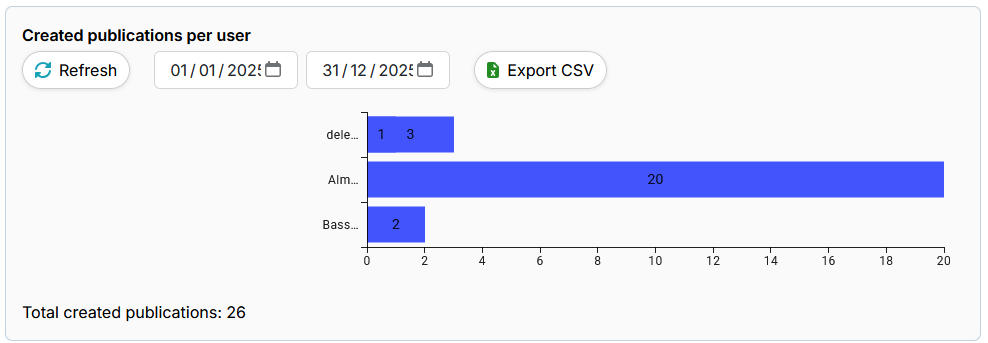
You can see the total number of publications created, as well as their breakdown by user, to track activity over a given period.
5.2.1. Items displayed :
Total publications created: Number of publications generated during the selected period.
Publications created by user: Creation of publications by user, allowing individual activity to be identified.
You can select the period to be displayed. This makes it possible to have data based on a user-defined time range, in order to analyze the evolution of publications over a specific period.
5.2.2. Actions available :
Refresh: Updates user-created publications in real time.
Export CSV: Download a summary file of information on publications created by a user in csv format.
5.3. Simultaneous user connections over a given period
You can view the number of simultaneous user connections over a given period, to monitor activity in real time.
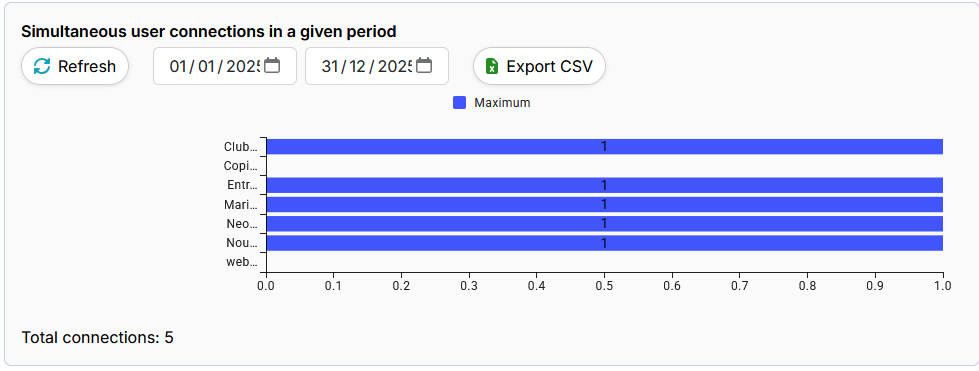
The image above shows 1 simultaneous connection in a given period on the Marinland workspace, for example.
A simultaneous connection means that at any given time, only one user session was active in the workspace. If several connections had taken place at the same time, the number displayed would have been higher. This measures the number of simultaneously active users on a platform.
You can select the period to be displayed. This makes it possible to have simultaneous connections according to a user-defined time range.
5.3.1. Actions available :
Refresh: Updates the data displayed concerning users' simultaneous connection in real time.
Export CSV: Download a summary file of information about a user's simultaneous connections in csv format.